Where the giants aren't: 64 industries that stayed Second Stage
In 64 industries holding 8.8 million Second Stage jobs, firms with 10,000 or more employees hold under 10% of jobs and have barely gained since 1998.
What we found
Firms with 10,000 or more employees took most of the share the economy shifted toward large companies. They didn't take it everywhere. A large group of industries has stayed almost untouched by giant firms for 25 years, while in others giants went from minor players to majority employers.
By sector
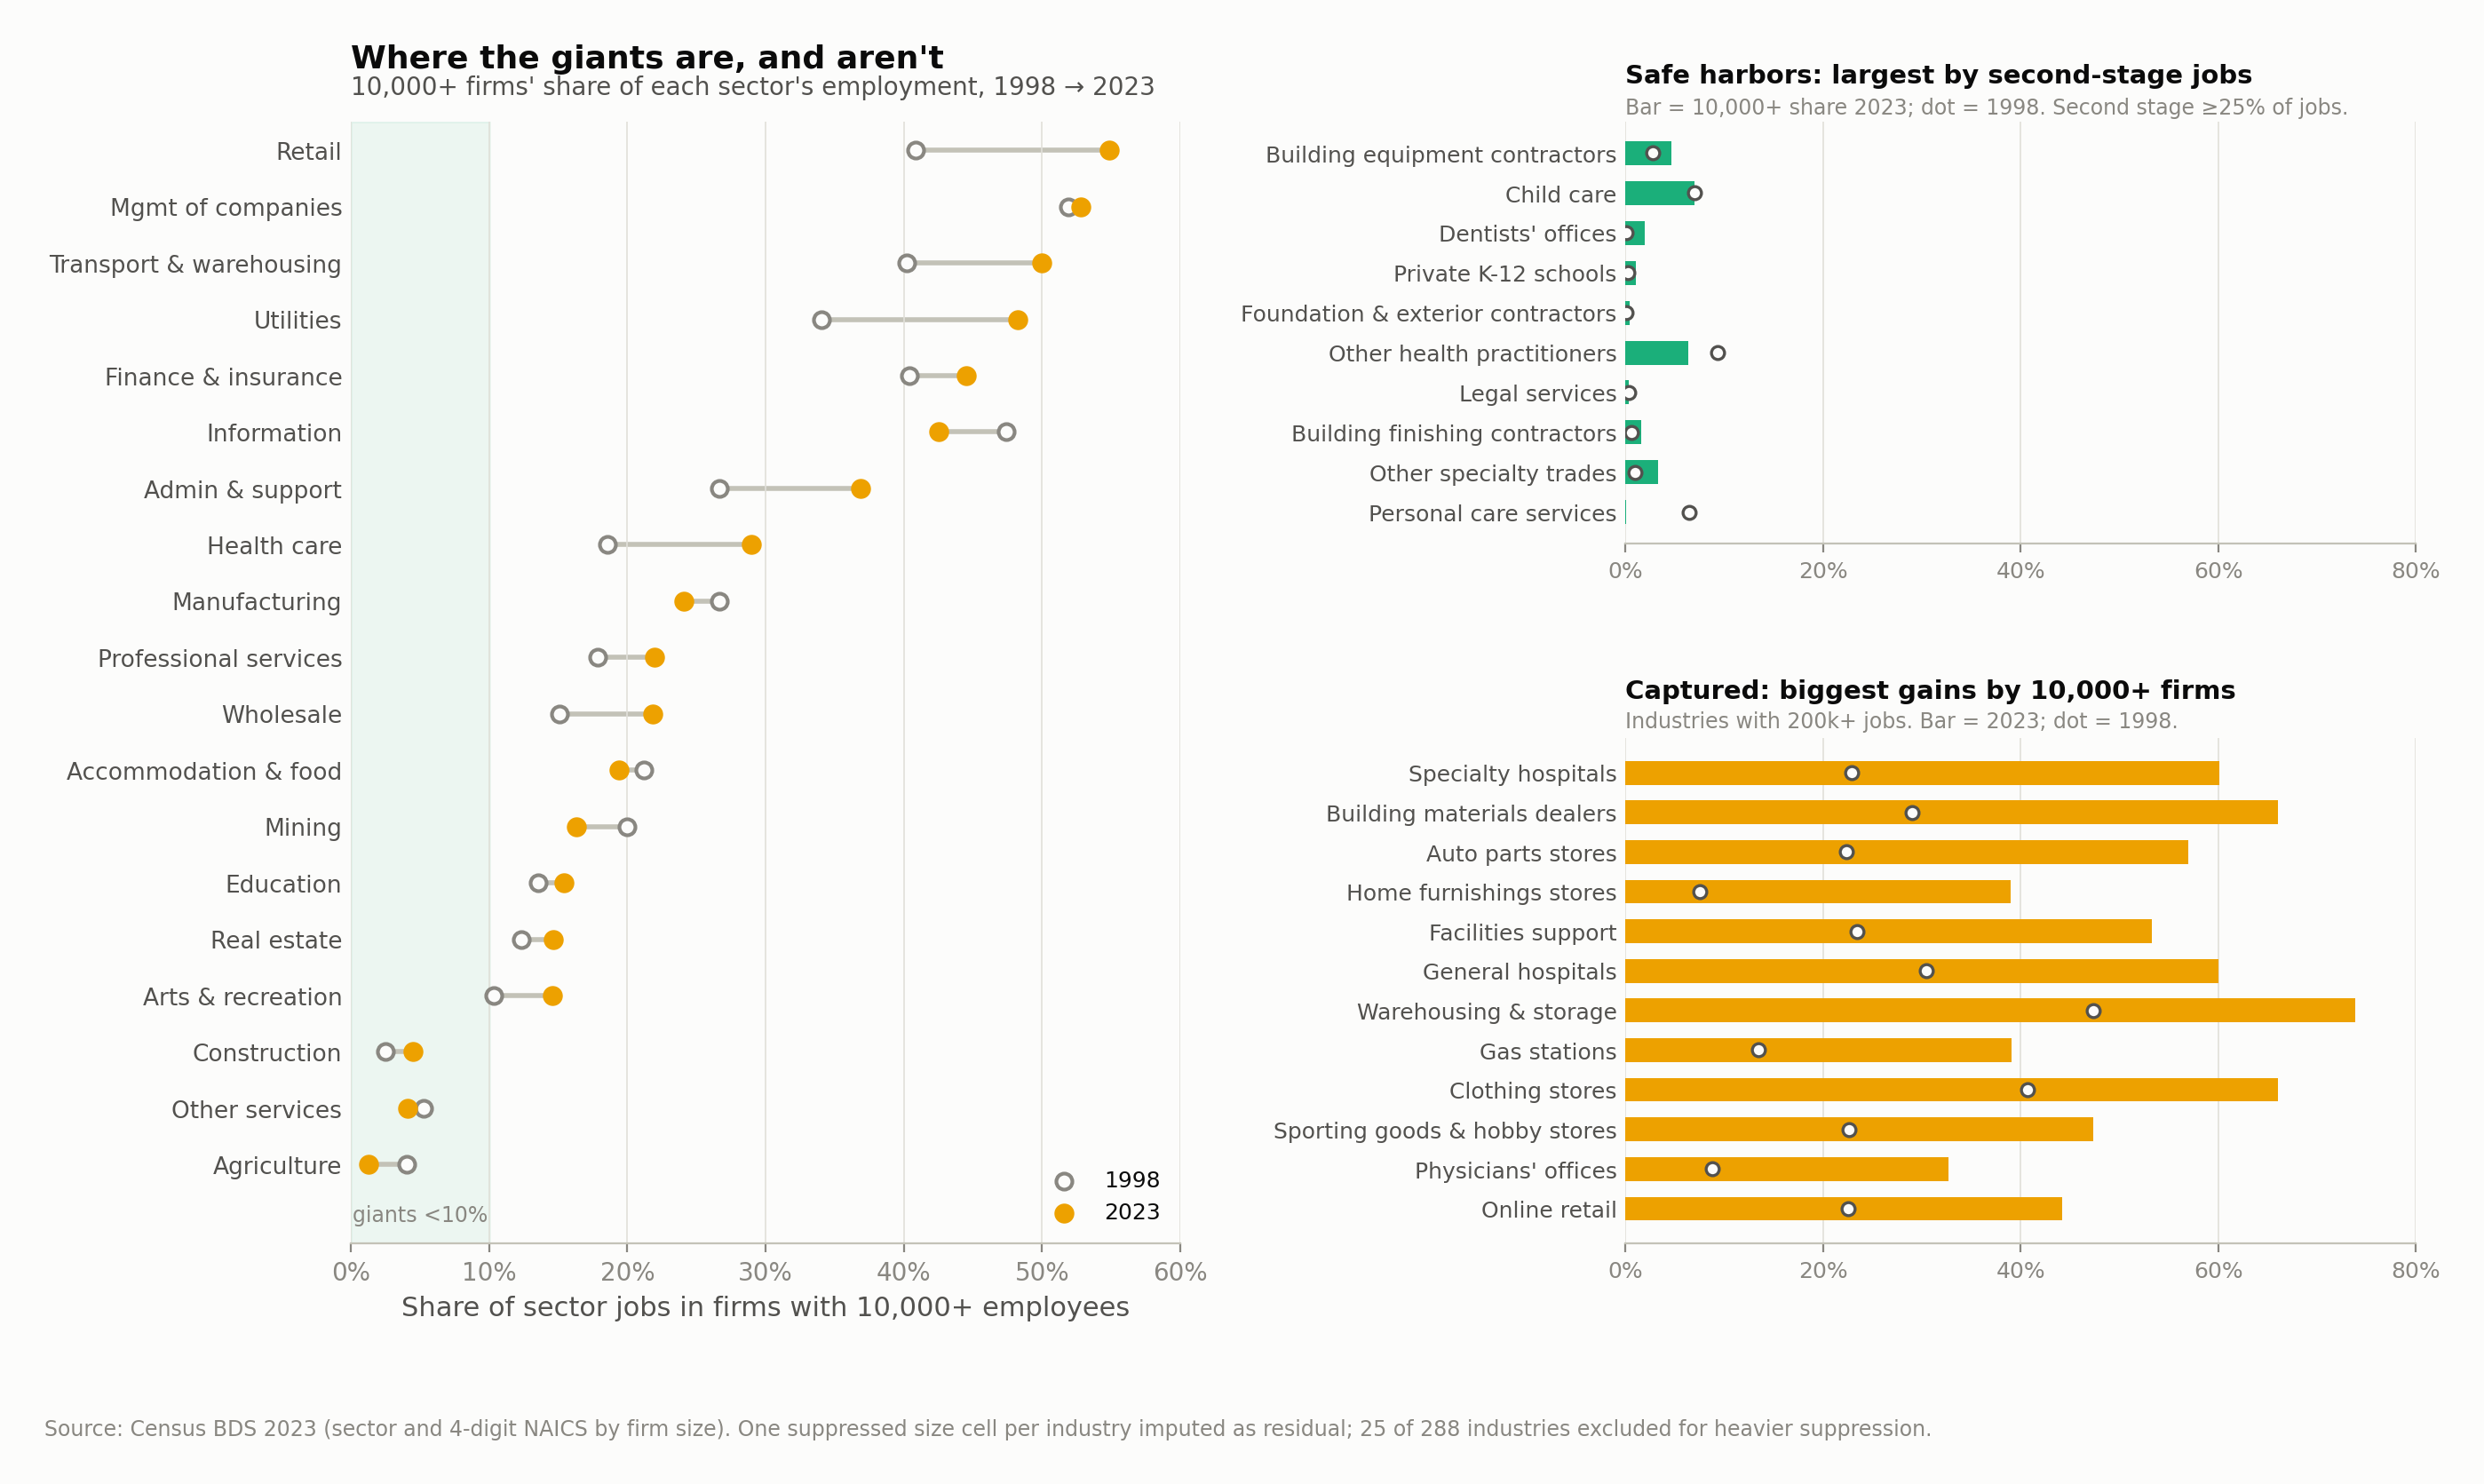
From 1998 to 2023, giants gained the most share in retail (41% to 55% of jobs), utilities, health care (19% to 29%), admin and support, and transport. They're nearly absent in agriculture (1%), other services (4%), and construction (5%), where Second Stage companies hold about 40% of jobs. Giants lost share in information, mining, manufacturing, and accommodation and food.
Safe harbors
Looking at 263 detailed industries, 64 meet three tests: giants hold under 10% of jobs, they've gained less than 3 points since 1998, and Second Stage companies hold at least 25%. Those 64 industries employ 21.5 million people, 8.8 million of them in Second Stage companies.
The largest by Second Stage jobs include building equipment contractors (HVAC, electrical, plumbing), child care, dentists' offices, private K-12 schools, foundation and exterior contractors, legal services, building finishing contractors, machinery wholesalers, specialized trucking, and machine shops.
Captured industries
In 54 industries employing 39.4 million people, the giants' share rose 10 points or more, and the Second Stage share fell an average of 7.8 points. The biggest moves include specialty hospitals (23% to 60%), building materials dealers (29% to 66%), auto parts stores (22% to 57%), general hospitals (31% to 60%), and warehousing (47% to 74%).
Physicians and dentists
In physicians' offices, the giants' share rose from 9% to 33%, and the Second Stage share fell from 41% to 24% as hospital systems bought practices. In dentists' offices, giants hold 2%, and the Second Stage share rose from 34% to 48%. Same kind of local professional service, different outcome.
The difference points to what makes an industry worth a giant's attention. For physicians, scale brought referral flow, leverage with insurers, and help with regulatory complexity. In dentistry those advantages are weaker.
What it means for owners
Know which kind of industry you're in. In a safe harbor, your competitors look like you, the threat is local, and the question is execution. In a captured industry, the competitive field has already changed shape, and the question is niche, partnership, or exit.
Whether a giant is coming is a question you can reason through. Ask whether scale buys something your customers pay for: purchasing power, network coverage, payer leverage, delivery density. Where it doesn't, the 25-year record shows giants have mostly stayed out.
A safe harbor can still be shrinking. Some, like machine shops and printing, are contracting industries, and giants may have stayed out partly because there was little to win.
The data is Business Dynamics Statistics for 1998 and 2023, by sector and by 4-digit industry. Of 288 industries, 263 had usable data. Where one size class was suppressed in an industry, it was filled in as the remainder; 25 industries with more suppression were excluded.
10,000+ employees is the largest size class Census publishes. Private equity roll-ups often sit in the 500–9,999 class and don't appear as giant gains. Dentistry and HVAC are two industries where that is likely happening.
Company size counts franchisees as small firms, so franchised industries can look more like safe harbors than they are.