The Second Stage has been losing ground since 1988
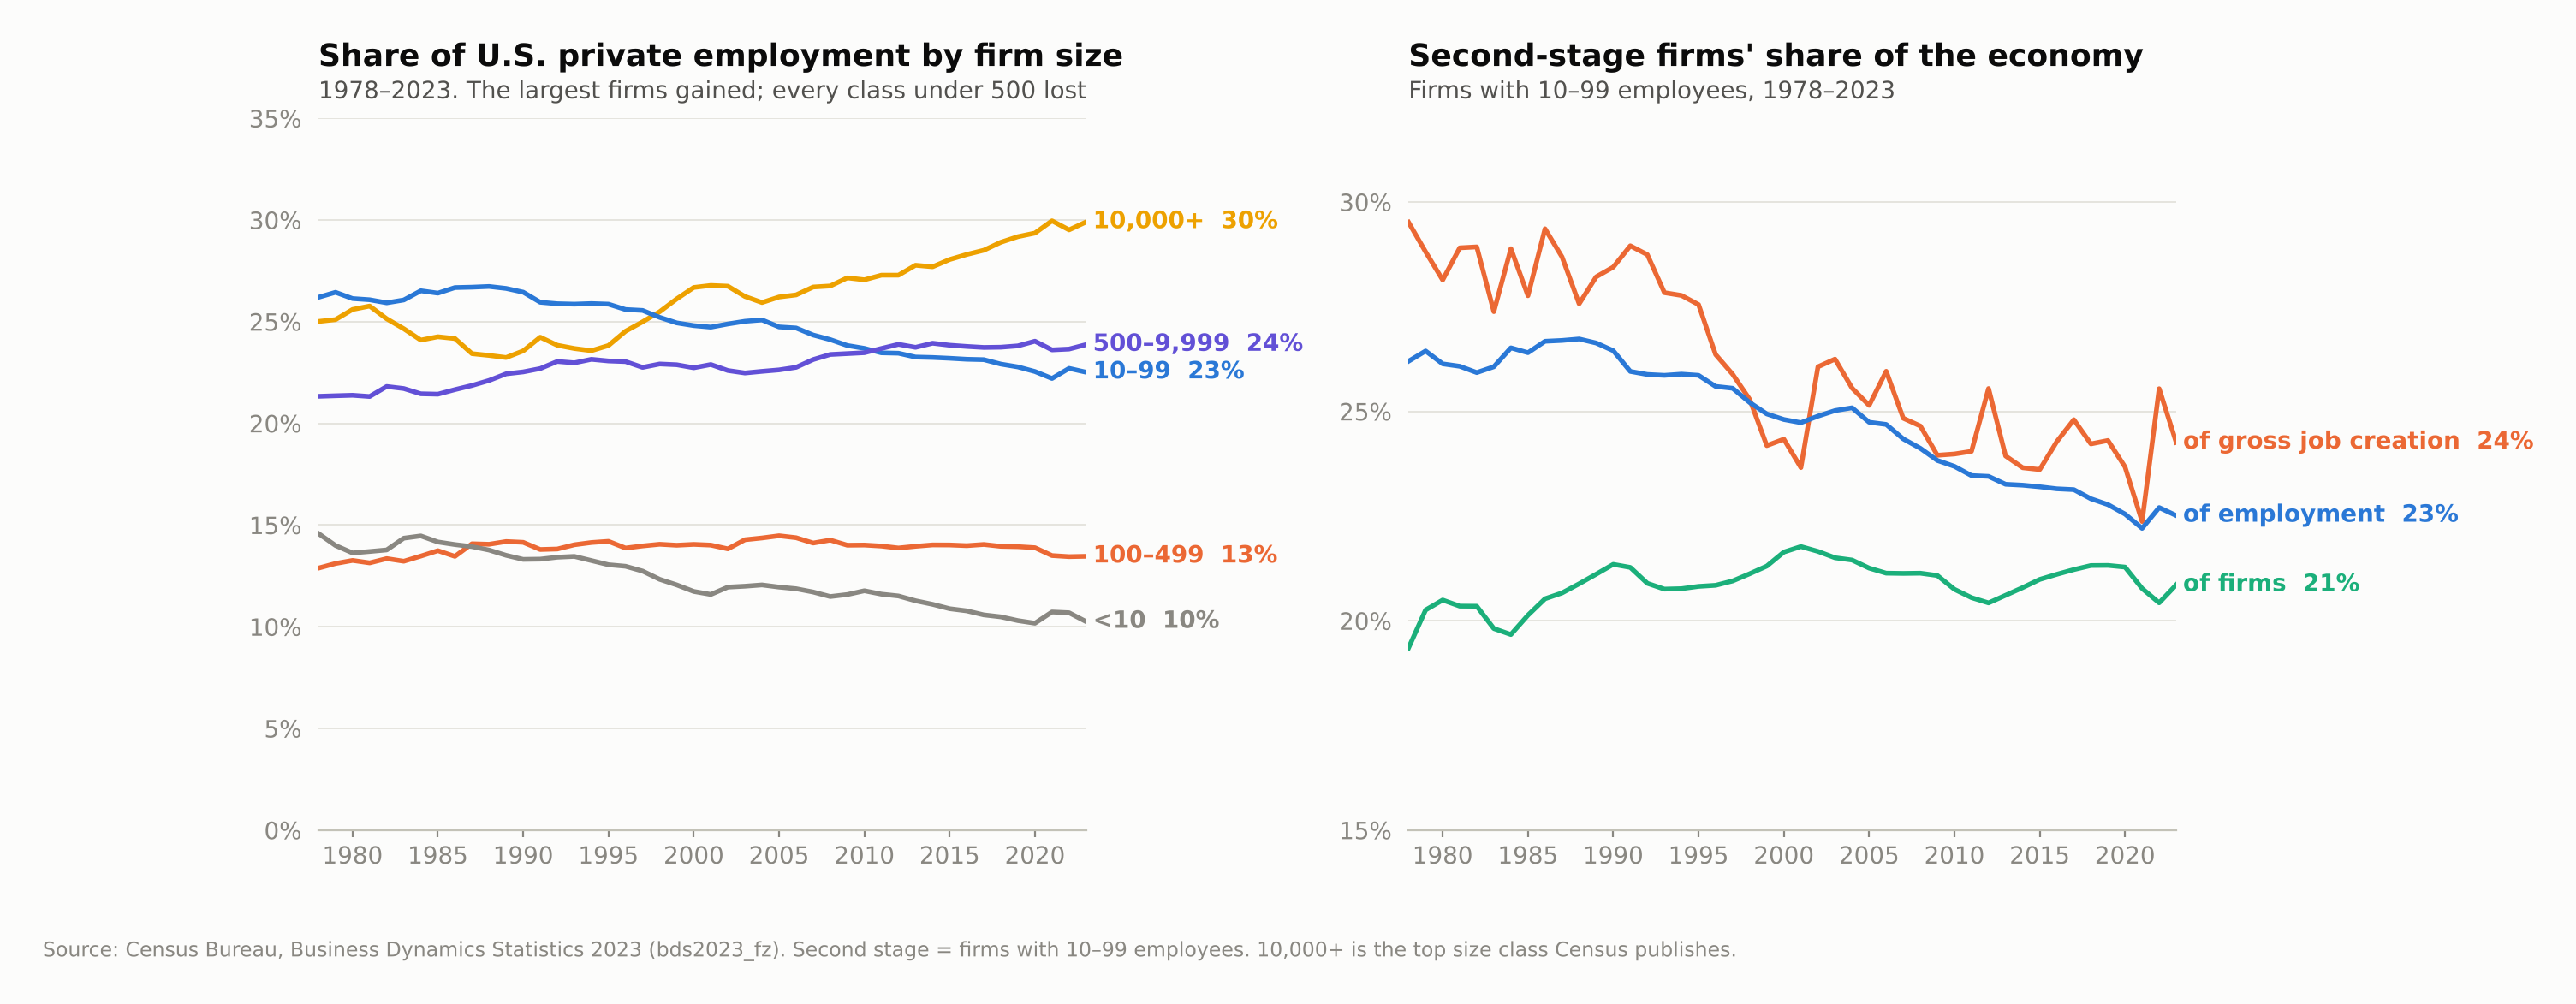
Second Stage companies held 26.7% of U.S. private-sector jobs in 1988 and 22.5% in 2023, while firms with 10,000 or more employees grew from 23.3% to 29.9%.
What we found
Second Stage companies, firms with 10 to 99 employees, held 26.7% of U.S. private-sector jobs in 1988. By 2023 they held 22.5%. That's the gap between the 30.9 million people they employ today and the 36.7 million they would employ if their share had held. About 5.8 million jobs.
The decline has been steady. The Second Stage's share of jobs rose in only five of the 35 years since 1988. Each economic expansion since 1990 ended with the middle holding a smaller share than when it began.
The number of companies didn't fall
Second Stage firms are about 21% of all U.S. employer firms, close to where they were in 1990. There are about 1.17 million of them. The middle has as many companies as it used to. Each one carries a smaller slice of the jobs.
Most of the ground went to one size class
Every size class below 500 employees lost share. Firms with 500 to 9,999 employees gained modestly, 1.8 points combined. Firms with 10,000 or more employees gained 6.6 points, from 23.3% of jobs to 29.9%. That's 79% of everything the larger classes gained. The 10,000+ class passed the Second Stage in 1998 and has stayed ahead.
The giants grew by getting bigger
Firms with 10,000+ employees rose in number by 23%, from 986 to 1,210. Their employment doubled, from 20.6 million to 41.1 million. The average firm in that class went from about 21,000 employees to about 34,000.
1988 is a turning point
The 10,000+ class was losing share from 1978 to 1988, falling from 25.0% to 23.3%. The year the Second Stage peaked is the year the giants bottomed out. Since then, one size class has pulled away from the rest.
The middle creates a smaller share of new jobs, too
Second Stage firms produced 29% of all gross job creation from 1978 to 1982. From 2019 to 2023, they produced 24%.
What it means for owners
If you run a 40-person company, the share of jobs held by companies your size has been shrinking for most of your career. That trend may have little to do with the company down the street.
The 100- to 499-person firms in your market have been losing share too. So have the smallest businesses. The firms gaining ground are a group of roughly 1,200 companies with 10,000 or more employees, and they've gained it by getting bigger, not by adding new players.
That changes the useful question. "Are bigger firms beating us?" is too broad. A sharper one is: are the giants in your market, and are they gaining there? In some industries they've moved in heavily. In others they've barely shown up, and a Second Stage company competes mostly with firms its own size or a little bigger. Later findings look at which industries are which.
Second Stage is measured as firms with 10 to 99 employees, counting all of a company's locations together. Size class follows the Census Bureau's Business Dynamics Statistics, which assigns each firm by its average employment across two years. That means a firm crossing 99 employees mid-year lands in whichever class its average falls.
Shares are of employer firms only. Businesses with no employees (about 28 million) are excluded.
The 2020 to 2022 period is distorted by the pandemic, PPP loans, and reopening. The jump in job creation in 2022 reflects that rebound and does not signal a change in the trend.
Statistics of U.S. Businesses, a separate Census data set, shows the same pattern for the years both cover: the Second Stage's share of jobs fell from 25.4% in 1998 to 22.4% in 2021.
10,000+ employees is the largest size class Census publishes. Public data doesn't show what happens inside it.