More startups reach the Second Stage. Fewer startups exist.
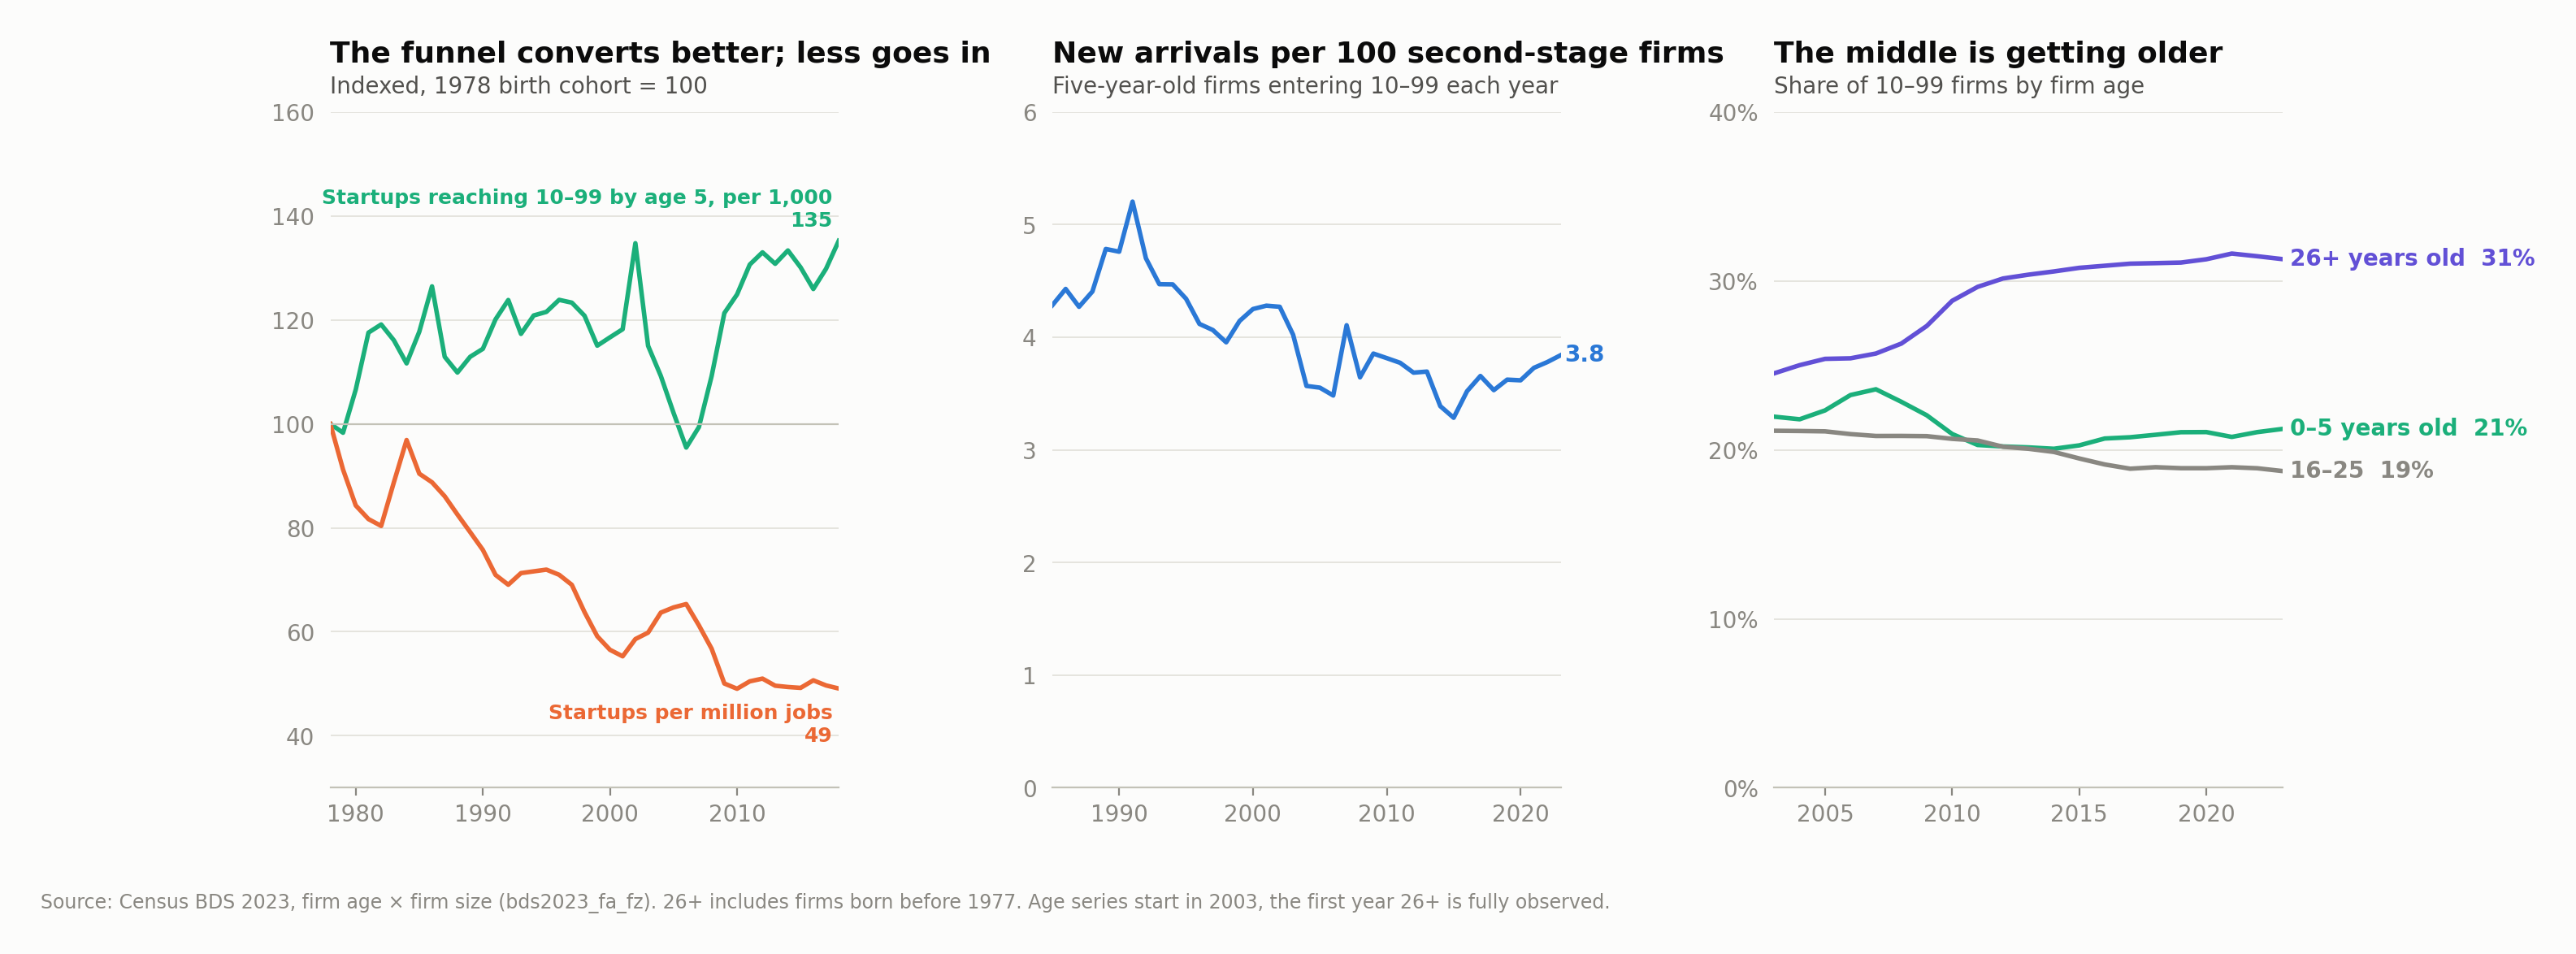
Startups reach 10 to 99 employees by age five more often than they used to (102 per 1,000 for the 2018 cohort, up from 75 in 1978), but startups per million jobs have roughly halved.
What we found
A common explanation for a shrinking middle is that fewer startups grow into it. The data supports half of that.
Startups convert better
Of every 1,000 firms founded in 1978, 75 had 10 to 99 employees five years later. For firms founded in 2018, it was 102. Five-year survival also rose, from 43% to 54%. The cohorts founded in 2005 to 2007 were the weak spot, hit by the recession two to four years in, and conversion recovered fully after 2010.
Fewer startups get founded
In 1978 there were 6,950 startups per million jobs. By 2000 there were 3,930, and by 2018, 3,410, about half the 1978 rate.
A thinner stream into a larger pool
About 40,000 to 45,000 five-year-old firms arrive in the Second Stage each year, roughly the same number since the late 1980s. The Second Stage itself has grown, so those arrivals renew a smaller fraction of it: about 4.7 per 100 existing Second Stage firms in the early 1990s, and 3.5 to 3.8 per 100 from the 2010s through 2023.
The middle is getting older
In 2003, 25% of Second Stage firms were 26 or more years old. In 2023, 31% were, and they held 34% of Second Stage jobs. The share that are five years old or younger held steady at about 21%.
What it means for owners
Nearly one in three of your peers has been in business more than 25 years. That points to a succession wave building inside the Second Stage, for owners deciding what comes next and for anyone planning to buy, merge with, or compete against those companies.
The Second Stage's shrinking share of jobs isn't mainly a startup story. Startups reach the middle at good rates. The share went to the largest companies.
For anyone working to strengthen Second Stage economies, the bottleneck is how many startups get founded. Help for young firms trying to scale is aimed at the part of the funnel that has been improving.
Firm age and size come from Business Dynamics Statistics, 1978–2023. Census reports single-year ages only through age five, so cohorts can be followed to age five, not further.
Reaching 10–99 employees is measured by average size across two years, so a firm at 9 employees one year and 12 the next may count. The trend holds either way.
Firms aged 26+ include those founded before 1977. The age mix starts in 2003, the first year the 26+ group is fully observed.