The consolidation fingerprint: who is taking share in each industry
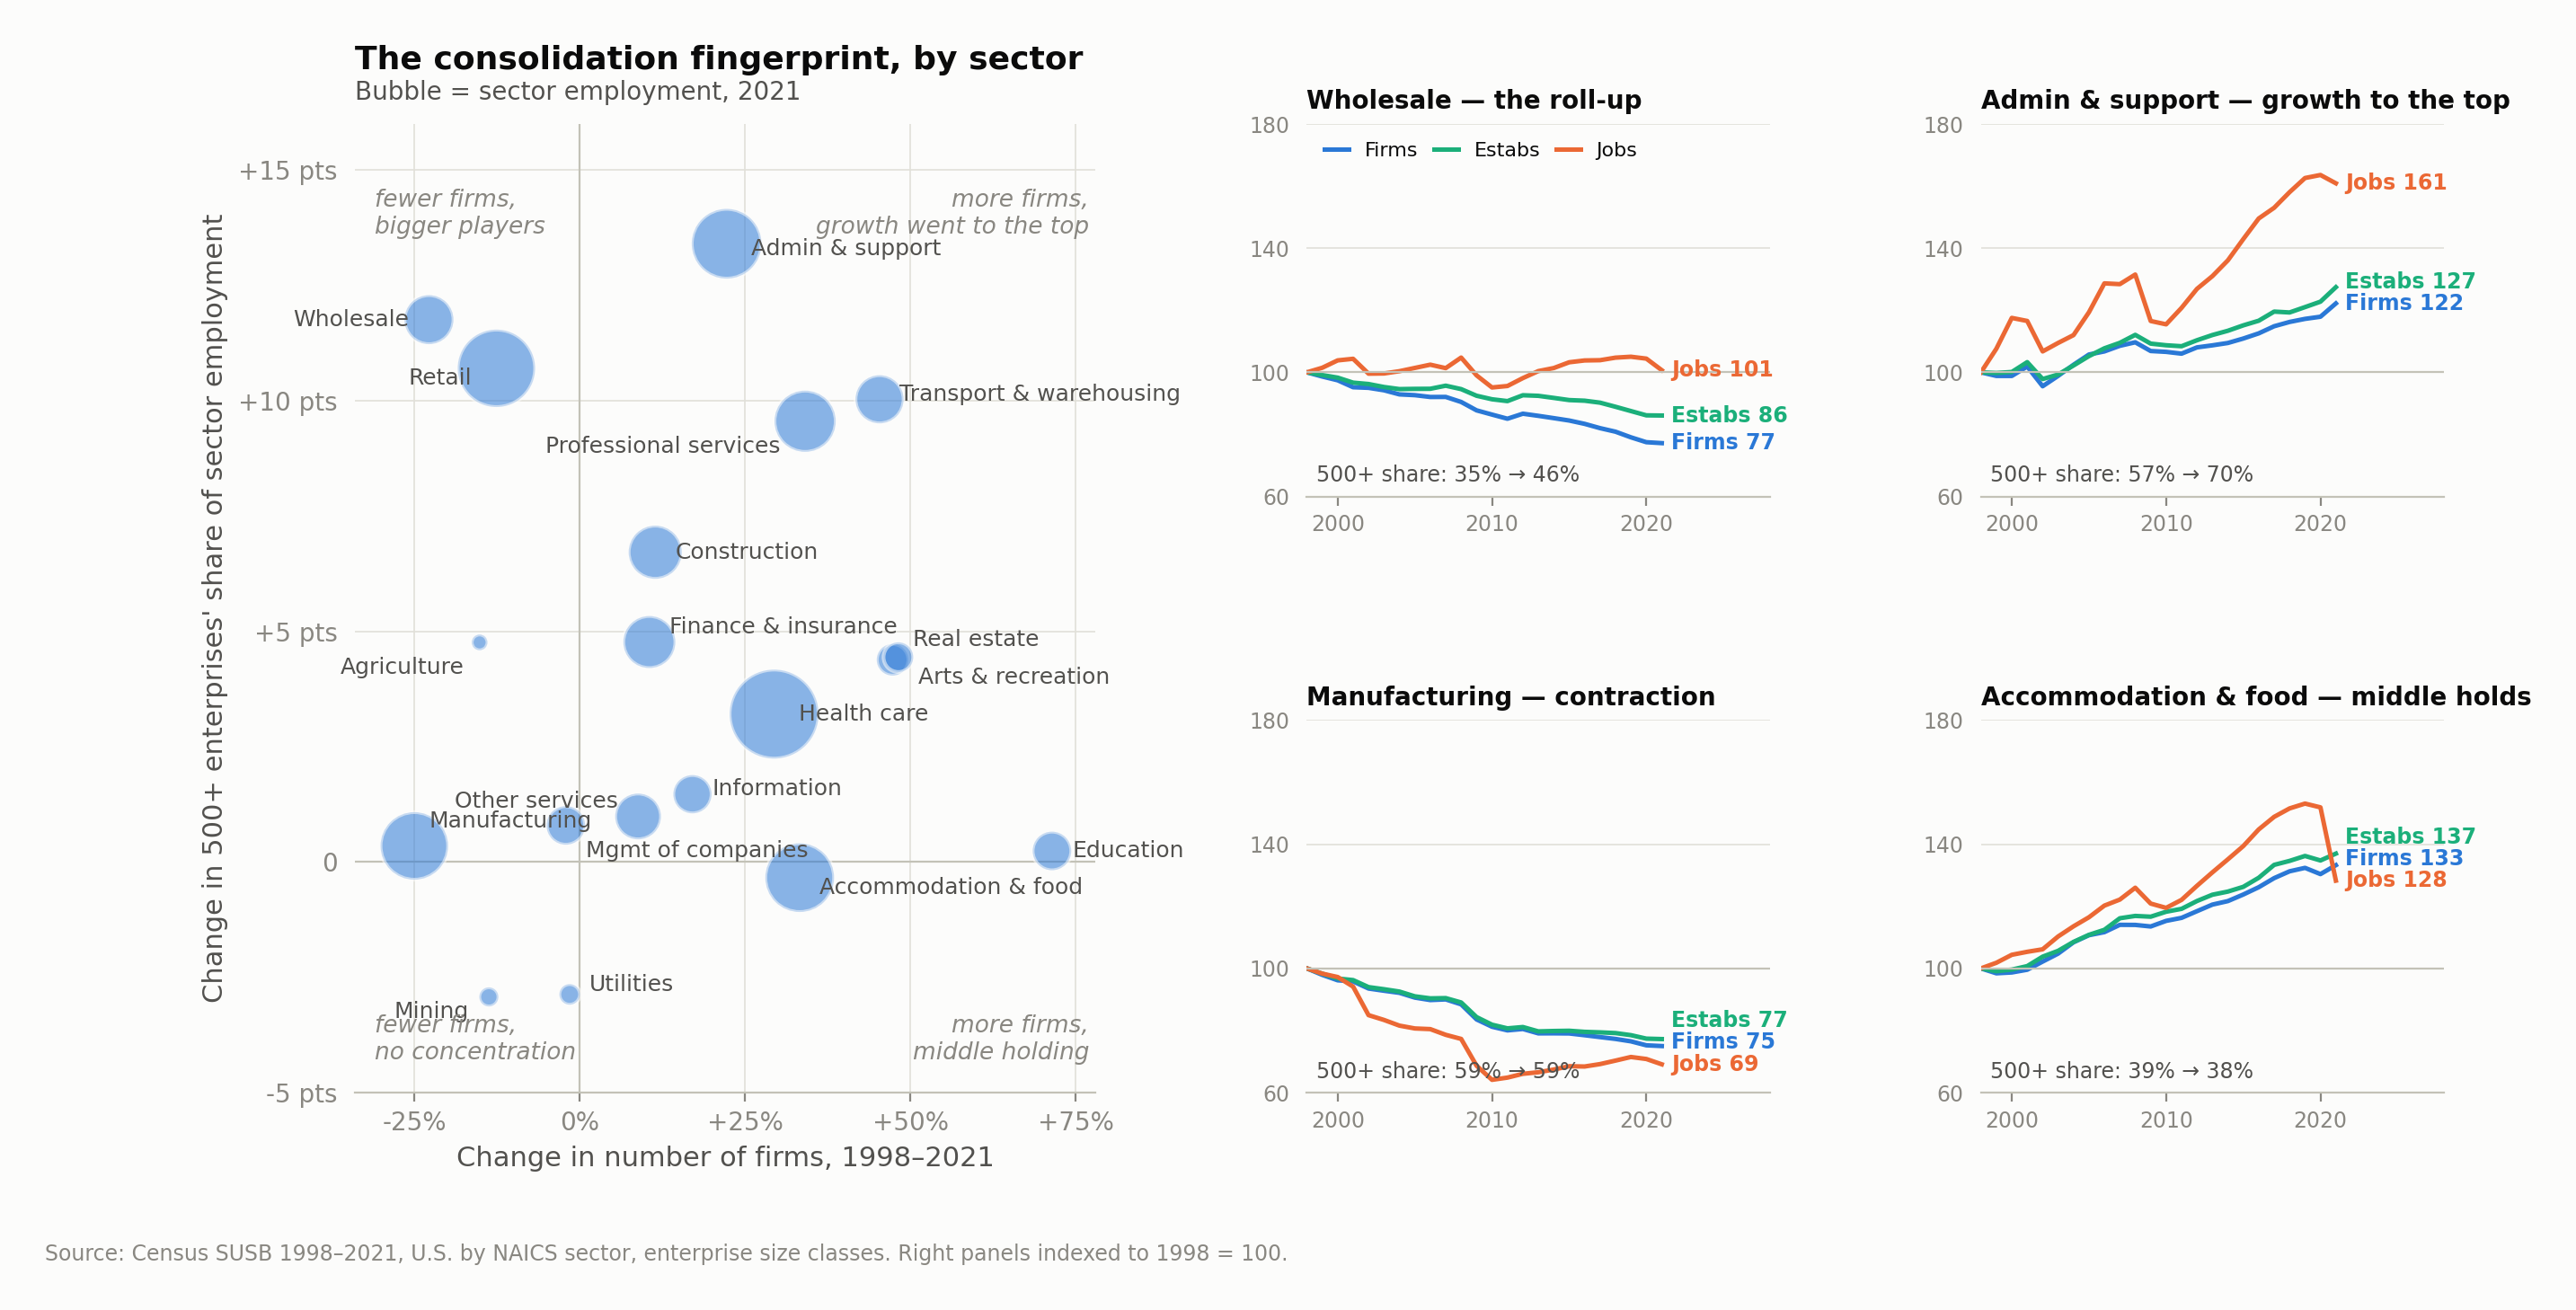
From 1998 to 2021, only wholesale and retail show a classic roll-up; across most of the economy, firm counts rose while large companies took a growing share of the jobs.
What we found
Consolidation leaves a signature in public data. The number of firms falls, while locations per firm, employees per firm, and the share of jobs at large companies all rise. From 1998 to 2021, only two sectors show that full pattern. Across most of the economy, something else happened.
Four patterns
The roll-up: fewer firms, bigger players. Wholesale is the clearest case. The number of firms fell 23%, from 363,000 to 281,000, while employment held flat and the share of jobs at companies with 500+ employees rose from 35% to 46%. Second Stage wholesalers went from 87,000 to 61,000. Retail shows the same pattern at lower intensity.
Growth to the top: more firms, but the big got bigger faster. In admin and support, professional services, transport, construction, and finance, the number of firms grew, and so did the number of Second Stage firms. Large companies still gained 5 to 13 points of share. Because firm counts rose, this pattern is easy to miss.
Contraction. In manufacturing, firms fell 25% and jobs fell 31%, while the large-company share held at 59%. Everyone shrank together. Mining looks similar.
The middle holds. In accommodation and food, health care, education, and utilities, sectors stayed fragmented while they grew. In accommodation and food, the number of firms rose 33% and the large-company share held near 38%.
Across the whole economy, the share of jobs at companies with 500+ employees rose from 49% to 54%, and the Second Stage share fell 2.9 points. The national picture is growth to the top. The U.S. didn't consolidate into fewer firms. It added firms and concentrated the jobs anyway.
Who is at the top
Splitting large companies into two groups, 500 to 9,999 employees and 10,000 or more, shows two different versions of growth to the top.
Driven by the giants. In retail, health care, admin and support, transport, and utilities, firms with 10,000+ employees took 9 to 14 points of share. In retail, health care, and transport, the 500–9,999 firms lost share alongside the middle. National chains, hospital systems, staffing companies, and logistics networks gained at everyone else's expense.
Driven by the upper middle. In construction, professional services, real estate, and partly wholesale, firms with 500 to 9,999 employees gained more than the giants. The winner is the regional or national mid-size company.
Giants pulling back. In manufacturing, information, and mining, firms with 10,000+ employees lost share.
What it means for owners
In roll-up sectors like wholesale and retail, acquisitions are happening, and the number of Second Stage firms has fallen 25% to 30%. The strategic choice is to be a buyer, a seller, or the independent the roll-ups can't replicate. Standing still is the option the data shows shrinking.
In a growth-to-the-top sector like professional services, transport, or construction, your company may well be growing while its relative position slips. Large firms are winning the added share. Absolute growth can hide relative decline.
Who is at the top changes the answer. A 2,000-person regional competitor can often be out-executed locally. A 50,000-person national one usually can't be matched on scale, so the question becomes where it won't compete.
Where the middle holds, as in accommodation and food or health care, scale hasn't been winning. The question is local execution.
The four patterns use Statistics of U.S. Businesses (1998–2021) by sector, treating companies with 500+ employees as one group. The split between 500–9,999 and 10,000+ uses Business Dynamics Statistics over the same years.
Company size counts each firm's national employment. A franchisee counts as a small firm, and a franchisor's company-owned locations count as large. That likely overstates how well the middle holds in accommodation and food, and understates consolidation in retail.
This measures consolidation in structure, not ownership. Private equity platforms that keep acquired companies as separate legal entities don't show up as fewer firms, so these results are a floor on consolidation. A 2007–2021 comparison gives the same ordering of sectors.